A Merry May on the Heels of an Awful April. The Merits of Staying Measured.

“It’s the economy, stupid!”
—Slogan coined by James Carville, well-known campaign strategist, and former President Bill Clinton during the 1992 presidential campaign
April showers brought May flowers, indeed. The S&P 500 advanced over 4% in May following a decline of that same magnitude in April.1 This past month was a nice “in your face” start to the much-maligned May through October period that erroneously and inaccurately gets a bad rap.
The old investment adage “Sell in May and Go Away” that suggests selling stocks in May and waiting until November to reinvest is a brilliant timing tool, just isn’t a wise or profitable strategy despite the popular suggestion otherwise. While it is true, historically, that S&P 500 returns in these early summer through early fall months are a bit softer than in the November to April time frame, they are handsomely profitable from May through October on average historically as well as most of the time. May’s robust results in 2024 set a nice tone for confirming the foolhardiness of accepting this often-asserted wives’ tale that just ain’t so. We’ll learn its fate for the full May through October period this year in just a few months.
Data Supports Stock Market Advance
Speaking of nice starts, the entire first five months of 2024 from January through May look like a good break out of the gate to us for the year, not just the month of May. The chart below illustrates that when the S&P 500 advances more than 10% in the first 100 trading days of a new year as it has this year (there are roughly 20 trading days in a calendar month), returns the rest of the year have tended to be very solid. Specifically, the 20 times returns have equaled 10% or more in the first five months since 1950, they have averaged almost 9% in the remaining seven months and have been negative only for the balance of the year in three of those 20 instances.
100 Days In: Strong Returns Tend to Signal More Strength Ahead
S&P 500 returns following a 10% rally 100 trading days into the year

Source: “100 trading days in: Why 2024 is different.” Data from Bloomberg Finance L.P. and J.P. Morgan as of May 24, 2024.
This data is rather encouraging, and it doesn’t seem like just a fluke or happenstance to us that solid, sustained starts like this that span over five months lead to impressive calendar year results, too, as the table above seems to suggest. Five months is a meaningful period for investors to assess a fair amount of data and determine if the trend in the data is supportive for stock market advancement through the balance of the year. The trumpeting of statistics by some that gains in the first few weeks of January tend to lead to good returns for the calendar year seems a bit hard to swallow as cause-and-effect analysis and behavior. Five months of positive results, on the other hand, feels a bit more telling as an indicator of likely trend to us.
Stock Leadership Broadens Out
One of the most compelling features of this year’s advance has been its broadening nature. To wit, roughly 70% of S&P 500 stock constituents are currently trading above their 200-day moving average. This is well above the narrow group of 10% of constituents trading above their 200-day moving average as we approached the final quarter of 2023.2 This year all 11 sectors of the S&P 500 have posted positive returns on a year-to-date and rolling 12-month basis.3 Yes, technology still handsomely leads the return derby, but contributions from communication services, industrials, materials, financials, energy and other sectors are meaningful. Even utilities have gotten into the act.
Regarding this latter sector, some are suggesting that the demand for power, which is on the rise due to artificial intelligence (AI) and cloud/data center build-out, is driving the renaissance in returns for utility stocks. We tend to think that, since their returns are regulated to a large degree, their strong performance of late is probably linked to investors’ rising confidence that inflation and interest rates are stabilizing. We shall see.
Regardless, this broadening out in leadership is a healthy sign for future stock market direction. And it is not surprising to us that leadership has continued to expand well beyond just the so-called Magnificent 7 stocks that led for much of 2023. Trends in earnings growth have much to do with this. The graph below illustrates that contributions to S&P 500 earnings growth was quite skewed toward the Magnificent 7 in 2023 and early 2024, but there is significant catch-up in contribution from the other sectors and non-Mag 7 as we move through the year and on into 2025. No wonder the non-Mag 7/other 493 stocks are perking up.

While most of the world right now seems frozen and hell-bent on focusing solely on speculation about what the Federal Reserve may or may not do, per usual, we take a broader view in establishing our outlook for the financial markets by comprehensively assessing the fundamentals, valuation levels and technical trends in stocks and bonds, which remain constructive. The FVTs, as we call them, paint a neutral to positive mosaic, which is what inspires us to remain measured in “hold your ground” mode with a year-end S&P 500 price target of 5,400 as we observe the May bounce back to near record-high levels from a modest April swoon.
Signs Point to a Resilient Economy
Why the solid price action in May as well as the first five months of 2024 and our continued solid outlook? As James Carville famously said during Bill Clinton’s 1992 presidential campaign, “It’s the economy, stupid.” The U.S. economy is standing solidly. This fact served as my inspiration for selecting Carville’s observation way back then to describe the key element of that particular political campaign as the quote of the month in our June commentary.
This quote can be equally effective in describing the key as to why the market is working today. Despite the barrage of hand-wringing media commentary day to day about the state of the union, the U.S. economy is simply in a resilient and quite elegant stage. The low unemployment rate and low unemployment claims data reveal strong demand for labor to drive consumption, yet we observe preliminary and necessary signs of easing in tight labor market conditions per lower quit rates and fewer plans to expand hiring and increase compensation. Softening inflation that has decelerated to the 2.7% to 2.8% level, per the Fed’s favored Personal Consumption Expenditures price index measures, is driving rising real (after-inflation) wage growth.4 Rising labor productivity is allowing corporations to increase wages and maintain or increase margins without raising prices as swiftly as they were these past several years.
Meanwhile, capital spending is solid as U.S. corporations reshore and invest in infrastructure. Real gross domestic product growth in the second quarter is pacing above a 3% level per current Atlanta Federal Reserve models, and we look for it to approximate 2% for the full year and contribute to double-digit earnings growth in both 2024 and 2025. At the same time, there are signs of slowing and moderating growth in some key areas, such as housing and manufacturing and service sector activity, that are necessary to gain confidence that things are not overheating.
As a result, we think the Fed is in a great position right now … inflation is falling just enough that policymakers can pause and could begin to cut rates in a reasonable time, yet the economy is strong enough that they don’t have to do anything. In this chapter, they are free to begin cutting in a slow and measured fashion when they are completely confident that they are ahead on the inflation front rather than begin cutting in a reactive, fearful fashion à la past cycles when they were forced to cut aggressively. In those prior periods, their previously employed, dramatically contractionary policy to contain runaway growth and inflation inspired recessionary conditions. This simply isn’t the case today. We should all relax a bit on this Fed phobia about what policymakers should or should not do. They are in a good spot at present, in our view.
Will Politics Be the Spoiler?
As we have said in the past, we take our cues on market direction by examining the FVTs. There’s a reason we don’t refer to them as the FVTPs and include politics in the process. Generally, elections cause temporary volatility, but once they are behind us, gridlock prevails and folks return to focusing on the FVTs and the drivers of long-term performance, regardless of who wins. We don’t think this year will be any different. The chart below shows that under all kinds of regimes or combinations, the market is generally positive because we are only approaching/in recession about 10% of the time. When earnings and profits expand and interest rates are at reasonable levels, the market does well. These are the long-term drivers of markets in the U.S., not politics.
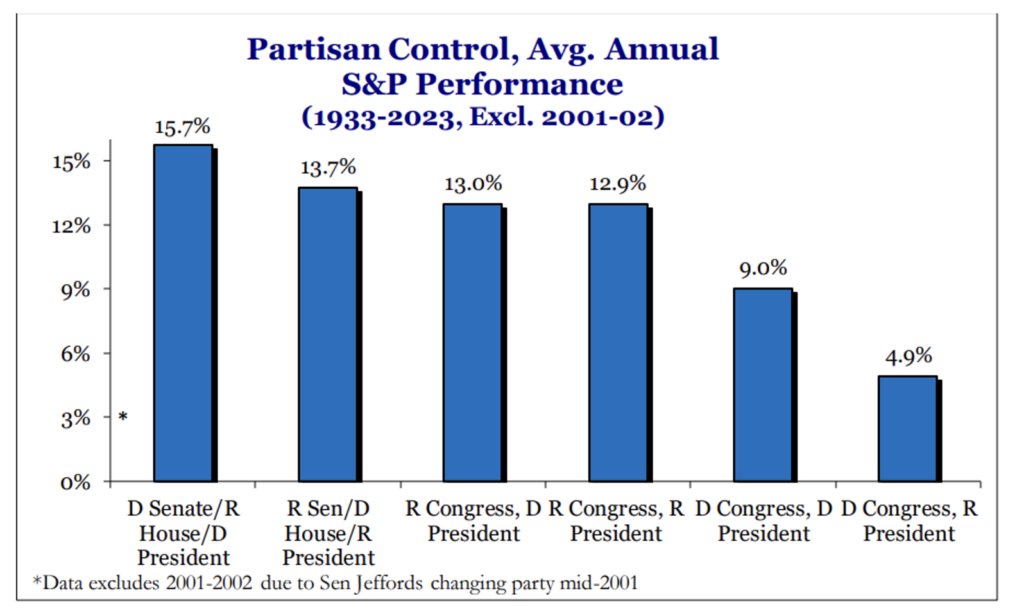
Source: Strategas
That said, there are several items to note in this year’s campaign. On the volatility front, former President Trump is a convicted felon—historic. President Biden has to deal with the nits about his age and perceptions of sticky inflation. So, both have issues. How voters resolve this appears to be a flip of the coin at present. The debates begin on June 27; sentencing for Trump is in early July. These could all be campaign-swinging, impactful events and drive temporary volatility, but again, eventually we go back to “the economy, stupid” as the driver of markets.
On a more positive note, we must remember that this is a reelection, not an open election. Returns historically are stellar during years of reelection campaigns when an incumbent is running for reelection as opposed to years of open elections with two unknown candidates battling. Specifically, in the last 13 reelection years going back to 1944, the market was positive in 13 of 13 of those occasions, with an average annual return of 16%.
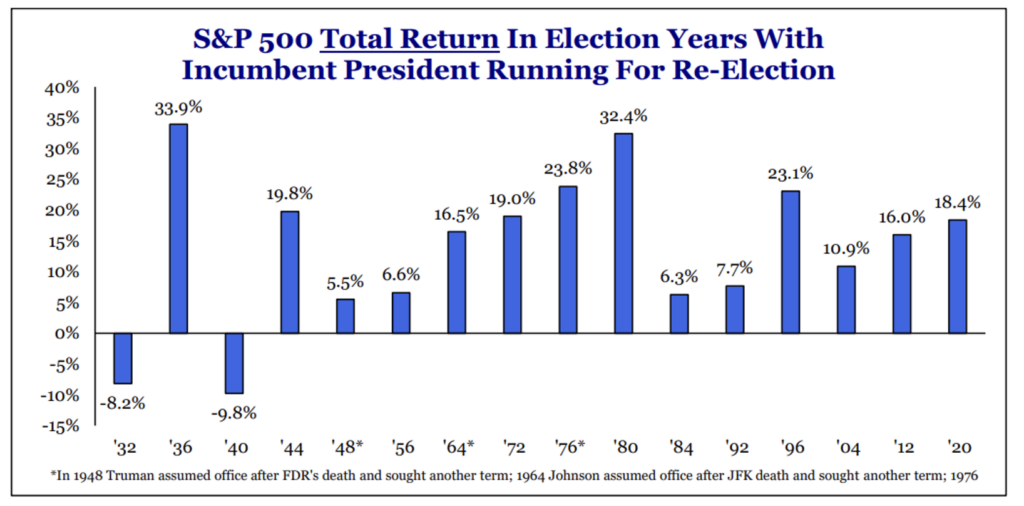
Source: Strategas
This is not surprising, as the incumbent is highly motivated to stimulate the economy prior to the election. President Biden is certainly providing stimulus this year in that spirit. Politics aside, this supports economic growth. Further, the candidates’ policies, and therefore the potential policy risk factors, are much more understood with known candidates the electorate has heard before.
Wrap-Up
Our ability to focus on the FVTs keeps us positive and in hold your ground mode. We also are maintaining our 5,400 target for the S&P 500 for calendar year 2024 and look to 2025 for further gains given current trends in the economy and earnings. We value getting trend right and believe that it continues to be positive for the intermediate and longer term. If we underestimate the 2024 S&P 500 price level by sticking with our 5,400 target for the calendar year, we are happy to suffer the consequence of investors being wealthier than we forecast. This, of course, could happen if a “melt-up” mentality ensues should the Fed begin to cut rates.
At the same time, despite our positive outlook and theme of “back to normal” in 2024, remember corrections in the 10% to 15% range are also normal before hitting new highs, particularly given wall of worry items out there that could always test investors’ nerves in the normal course. For those disappointed that we aren’t taking our 5,400 S&P 500 price target up for 2024, the Mariner internal equity team remains inspired by the opportunity to attempt to prudently add value in a broadening market via active stock selection. Further, 5,400 represents a very nice double-digit gain in the passive index as well, should it rest there.
We will be providing you with our midyear assessment and update of our July Crystal Ball Outlook next month that will include establishing additional targets for the S&P 500 looking out 12 months through mid-2025. Stay tuned!
Sources:
1-4FactSet
This commentary is provided for informational and educational purposes only. It is not intended to be personalized advice or a recommendation to buy or sell any security or engage in a particular investment or other strategy. Nothing herein should be relied upon as such, and there is no guarantee that any claims made will come to pass. Actual results or developments may differ materially from those projected. The information is deemed reliable, but we do not guarantee accuracy, timeliness, or completeness. It is provided “as is” without any express or implied warranties. Any opinions expressed are subject to change without notice and are not intended as investment advice or to predict future performance.
Investing involves risk and the potential to lose principal. Past performance does not guarantee future results. Please consult your financial professional before making any investment or financial decisions.
The indexes referenced herein are unmanaged and cannot be directly invested in. The S&P 500 Index is a market-cap weighted stock index constructed to track the share price performance of the top 500 large-cap U.S. equities.
Mariner is the marketing name for the financial services businesses of Mariner Wealth Advisors, LLC and its subsidiaries. Investment advisory services are provided through the brands Mariner Wealth, Mariner Independent, Mariner Institutional, Mariner Ultra, and Mariner Workplace, each of which is a business name of the registered investment advisory entities of Mariner. For additional information about each of the registered investment advisory entities of Mariner, including fees and services, please contact Mariner or refer to each entity’s Form ADV Part 2A, which is available on the Investment Adviser Public Disclosure website. Registration of an investment adviser does not imply a certain level of skill or training.