September Fed Rate Cut Melt-Up: Warranted—or Prelude to an October Meltdown?

Statler (S): That was the worst thing I ever heard!
Waldorf (W): It was terrible!
S: Horrendous!
W: Well, it wasn’t that bad.
S: Oh, yeah?
W: Yeah, it was GOOD, actually.
S: Yeah, bravo!
S & W: More!!
— Excerpt from well-known Statler and Waldorf “Muppets” characters’ skit
After a slow start in the first 10 days of September—during which investors once again fretted about what the Federal Reserve may or may not do in its mid-month rate decision meeting and perspired a bit about another employment report on Sept. 6 that suggested the labor market finally is cooling at a moderate pace (ironically, isn’t this what all the experts wanted to gain confidence the Fed can win the battle over inflation?)—the S&P 500 rallied over the balance of the month and generated a more than 2% gain over the 30-day period.1
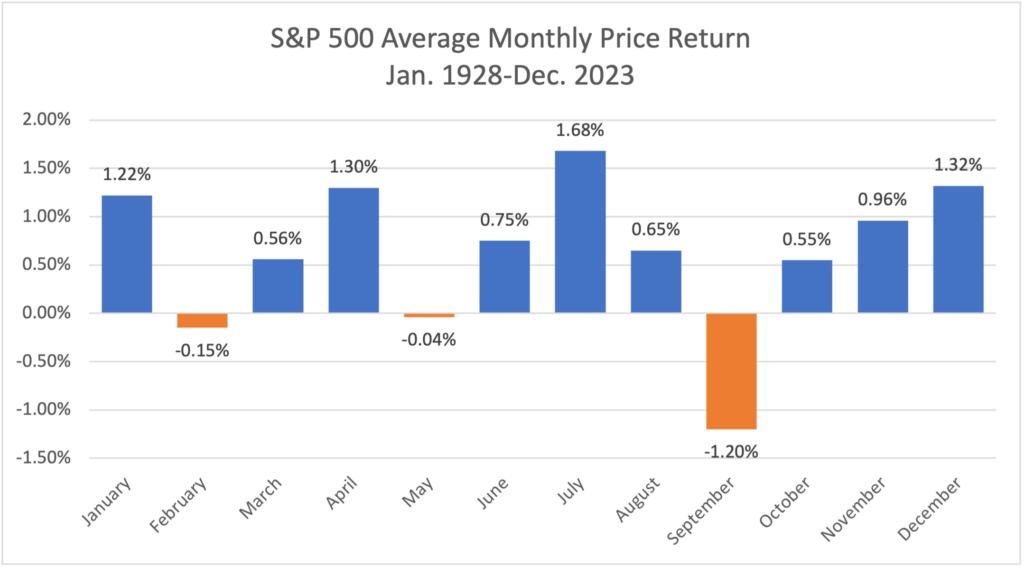
That performance report card is an A+ in our eyes, considering September is the worst month to invest in stocks, according to historical data. To wit, since 1928, September has recorded an average monthly return of -1.2% and has generated a negative result 56% of the time.2 Ouch! Nice to see this September buck that tendency.
Rate Cut Fuels September Returns
One of the factors that drove this September’s nice return was the 50-basis-point rate cut by the Fed that it announced on Sept. 18. Going into the meeting, it seemed to be a flip of the coin as to whether policymakers would cut by 25 or by 50 basis points, and speculation about what the Fed governors might decide was as front and center as any historic pre-game Super Bowl coverage we’ve ever seen.
Investors appeared to react in slightly disappointed fashion to the outcome of the Sept. 18 Fed meeting on the afternoon of the decision, as the S&P 500 sacrificed nice gains generated in the earlier moments of the day’s trading session to end the day down 0.3% by the closing bell.3 It seemed that investors initially interpreted the larger 50-basis-point cut as a signal the Fed feared the economy, and the labor market specifically, might be slowing down too much and that the rate-making committee’s decision reflected its own fears that it could be behind the curve in beginning its easing in monetary policy.
Once again, investors proved fickle as their reflexive selling-oriented mood swiftly reversed course after the immediate post-decision losses on Sept. 18. Significant purchase volume bid prices up handsomely the next day. The S&P 500 rallied with a vengeance on Sept. 19, rising over 1% to new all-time highs above 5,700.4
A Focus on the FVTs – Not Investors’ Reactions
This head-spinning shift in investor mood overnight inspired me to reminisce about the very funny Muppets skits executed so well by their Statler and Waldorf puppet characters in years past. I used to laugh uncontrollably when my young children watched the Muppets, and these two puppet characters performed this routine alluded to at the beginning of this commentary: “This is the worst thing I ever heard. No, wait … it’s good, actually—Bravo—More!” Exactly!
This Statler and Waldorf schtick so aptly captures investors’ frequent volatile tendencies, exhibited during this September Fed-decision moment as well as during many other “breaking news” moments. Guessing investor reactions to various news flow events is just one of those things that makes a portfolio manager’s job fascinating! That’s why we always focus on longer-term trends in the fundamental, valuation and technical data—the FVTs—to determine outlook of the market in the upcoming 12 to 15 months. We remain positive and maintain our S&P 500 target of 6,000 by mid-2025. We believe that in an optimistic case, we could see 6,600 by the second half of next year.
Bottom line … whirlwind shifts in investor reasoning is just part and parcel of investing in stocks.
Is This a Market Melt-Up? Or a Prelude to a Market Meltdown?
The S&P 500 is up over 21% through the first nine months of 2024 after a very solid showing in August and September.5 This is on the heels of the 26% return in 2023.6 After the 2% gain in September, the S&P 500 reached new all-time highs, surpassing the 5,700 price level. Further, the price level of the index stands moderately above our calendar year-end 2024 target of 5,400. Some well-known peer strategists at various firms are examining the idea that some sort of market melt-up is underway and what that may portend for future returns.
Along these lines, Barron’s published an article in late September entitled “The Stock Market Is Melting Up. When to Worry About a Meltdown.” Similar-headlined articles have appeared in The Wall Street Journal, with some focused on what could be on the other side of a so-called melt-up. In early August, after the disappointing payroll report was released, the newspaper led with the headline “Is This 1987 All Over Again? What’s Driving the Market Meltdown?”
Fortunately, the paper’s characterization of the weak start to August as the beginnings of a meltdown was a false alarm and an example of market overreactions to labor market data that, while disappointing versus expectations, was quite normal. The early August pullback was over in a nanosecond. The market went on to higher highs in short order.
Our Take on the Idea of a Melt-Up
Investopedia defines a melt-up as:
“A dramatic and unexpected rise in an asset class, driven partly by a large number of new investors seeking to chase returns.”
The concept implies that investors have become too giddy, the market has risen to unjustified levels and that like the Octobers of 1929, 1987 and 2008, the end of the story won’t be pleasant.
In addressing this idea, we would first say that a double-digit advance this year is warranted based on healthy fundamentals and does not represent a bubble or classic “castle in the sky” scenario of bear market risk buildup in our mind. Our 2024 calendar year-end price forecast that we established back in January assumes a 15% annual return. Solid. This alone affirms that we’ve been constructive for some time for good reason. In the three bear market periods referenced above, economic conditions had been deteriorating for some time while the Fed was still increasing interest rates and rates in general were rising in uncomfortable fashion … the polar opposite case is true today.
Fundamental Data Continues to Trend Positively
Inflation has consistently declined throughout the year. The Personal Consumption Expenditures index (the inflation index closely watched by the Fed) released Sept. 27 rose only 2.2% over the 12 months through the end of August … within spitting distance of the Fed’s long run 2% target.7
While inflation calms, the economy may be exhibiting signs of slowing in some of the labor market data to normal or average growth rates, but it continues to expand. Real gross domestic product growth for Q3, for instance, looks to be pacing at a 3% rate, per the Atlanta Fed. Earnings growth estimates for 2024 and 2025 remain sticky at impressive rates of 10% and 14%, respectively.8 Importantly, labor productivity increased by 2.7% in Q2. Rising productivity allows companies to increase wages to healthy levels and maintain profit margins without being forced to raise prices as workers produce more per hour in a robust demand environment. That’s a potent cocktail for continued high-quality growth in consumer spending and corporate earnings.
This combination of inflation calming while economic growth moderates serves to facilitate a Fed policy strategy of steady easing versus panicked easing to stave off recession. In the Summary of Economic Projections tabulated by the Fed during its mid-September meeting, it signals an expected additional 50 basis points in rate cuts this year and 100 basis points in 2025, thus taking the fed funds rate back down to 3.5%. This telegraphed drop in short rates should drive a re-steepening in the yield curve yet enable intermediate 10-year yields to hover close to current moderate levels and allow mortgage rates to fall further.
Such yield trends should be helpful for retired couples who need decent returns on the intermediate bonds in their fixed income portfolios while also supporting increased home-buying activity via improving mortgage rates … all healthy trends for consumer spending. Couple this with lower gas prices, and it serves as a nice “tax break” to consumers across all demographics. This simply makes the point that the market has not advanced merely on hopes and dreams. The trends in the fundamental data have been supportive.
Healthy Signs on the Technical Price Trend Front
As the market has advanced, leadership has broadened out significantly over the last three months. A number of non-tech sectors in the S&P 500 have been leading the way: financials, industrials, materials, utilities, staples and more recently, even consumer discretionary.
It’s not all about tech right now … if it were, that might bother us in terms of concern about melt-up.Similarly, the more diversified equal-weighted S&P 500 has almost doubled the return of the more concentrated market-cap-weighted S&P 500 index since the early August market bottom; small caps have been performing well versus large caps of late yet still maintain significant runway given that they have not recaptured record highs. The emerging market international index has broken out and handsomely bested the S&P 500 this past quarter. Again, these are healthy signs not typical of return chases and market melt-up.
It All Boils Down to Valuation
Our 5,400 target for the S&P 500 at Dec. 31, 2024, assumes a 20 multiple on consensus 2025 earnings of $275. Reasonable. Our 6,000 target for mid-2025 represents a similar multiple on forward 12-month consensus earnings of $295. Our upside target of 6,600 for 2025 represents a 21-ish multiple on expected 2026 earnings of $317.
Again, these are all reasonable multiples. The current 5,700 price level fits nicely within this longer-term glide path we envision, even if it is slightly above our calendar 2024 final resting place at present of 5,400. In other words, this doesn’t appear to be a market melt-up to us, the likes of which imply a future bear market. Should investors get giddy, however, and bid prices and price-to-earnings (P/E) levels up to the 6,000-plus level ahead of our anticipated schedule, that could make 2024 way better than we expected and lead to flat or unexciting gains in 2025 as earnings grow into the multiple. P/E multiples of 20 to 21 feel reasonable to us. Multiples of 23 to 24 feel excessive.
Further, in our view, such a melt-up and ahead-of-schedule gains would simply present a marvelous opportunity to trim stock allocations back to long-term strategic targets after such a surge that surely would cause them to drift above target. But this is a far different and more palatable risk than a bear market meltdown that we don’t envision. Short of some external shock event, that is.
Could the Election Be the Spoiler?
We could have featured politics and elections in this month’s commentary, considering the November event is soon upon us. But you know that we feel the market is driven by the FVTs, not politics. We’ve been clear about this in our Crystal Ball and special reports.
Election-year returns are similar to returns in all years, and historical data proves that returns, through the four-year presidential cycle, are positive on average and similar regardless of who runs Congress or the White House. Premature speculation about what policy will be enacted when you don’t even know who the winner will be or what they will propose is a money-losing proposition and borderline reckless. We have plenty of data to support these conclusions. Politicians propose, but the markets dispose.
Uh-Oh – It’s October Again! Steel-Up
Buyer beware of seasonality! October has earned the reputation as being a very dangerous month for the stock market. There are a handful of sharp October selloffs that remind all of us that strange things can happen in this month of goblins, witches and trick or treating. These include:
- The 25% plunge over two days on Oct. 28 and 29 in 1929
- The shocking 20.47% decline on Oct. 19,1987, the largest one-day loss on record for the S&P 500
- The 27% decline from Oct. 1 through Oct. 28, 2008, in the midst of Lehman Brothers’ failure and the U.S. housing implosion9
Well before these intimidating events, October had earned a bad rap. Mark Twain penned one of his famous quotes below in his book “Pudd’nhead Wilson” in 1894, far in advance of the above October crashes:
“October … This is one of the peculiarly dangerous months to invest in stocks. The others include July, January, September, April, November, May, March, June, December, August, and February.”
These infrequent but historically large drops in October that we cite above do grab one’s attention. Particularly in a year like 2024 when we face certain emotional issues like the presidential election that is close at hand and the rising geopolitical tension and conflict in specific geographic regions of the world.
That said, we clearly believe October doesn’t deserve its tainted reputation and disagree with Twain. While a prolific American writer, he evidently did a poor job of investing his wealth. His poor opinion of October and assertion that all months are difficult to invest in stocks is not supported by the facts. In fact, the chart below demonstrates that October is a positive month for stocks on average going back to 1928 and illustrates that stocks generate positive average monthly returns in nine of the 12 calendar months over that period—a 75% positive hit rate.
Recessions and Long-term Market Declines Are Rare
The only significantly negative-return month throughout history is September. Lore has it that this is the month investors return from summer vacation and after avoiding reality for several months at the beach, they must face the music and adjust their portfolios, whether based on fundamental concerns or for tax-loss selling reasons.
Perhaps there is some cause-and-effect reasoning to this “September effect.” Note that the other two loss months—February and May—are barely negative, however. Regardless, the chart shows October to be unfairly discredited, posting an average monthly return of 0.5%, despite these few sharp/swift drawdown moments (in 1929, 1987 and 2008) of rare magnitude.
Also, we’re not surprised to see positive average monthly returns 75% of the time. Why? Because 87% of the time, the U.S. is in economic expansion mode, and 73% of the time earnings are positive. Recessions and years of S&P 500 earnings declines are rare (only 13% and 27% of the time, respectively). Bottom line, “It’s the FVTs, stupid!” as James Carville might say. Yes, emotions are volatile and run rampant from time to time, but the market uses the FVTs as its guide on most occasions, as do we. Most of the time they are healthy. Mark Twain didn’t get that concept … but it sure would have been nice for him to edit our commentary from a grammatical and literary standpoint!
Wrap-Up
We are very focused on the trend in economic growth, earnings, inflation and rate levels overall rather than on political events that serve as temporary distractions and shorter-lived sources of volatility. The fundamental metrics that truly drive stock prices are constructive at present. Our key concerns and the wildcard factors we monitor center on the future path of interest rates during a time of larger fiscal deficits as well as the path of labor productivity and profit margins. If they play out as we expect, the outcome for stock returns should be solid.
Sources:
1-6FactSet
7Bureau of Labor Statistics
8,9FactSet
This commentary is provided for informational and educational purposes only. As such, the information contained herein is not intended and should not be construed as individualized advice or recommendation of any kind.
The opinions and forward-looking statements expressed herein are not guarantees of any future performance and actual results or developments may differ materially from those projected. The information provided herein is believed to be reliable, but we do not guarantee accuracy, timeliness, or completeness. It is provided “as is” without any express or implied warranties.
The S&P 500 is a capitalization-weighted index designed to measure the performance of the broad domestic economy through changes in the aggregate market value of 500 stocks representing all major industries. The S&P 500 Equal Weight Index is designed to track the equally weighted performance of the 500 stocks in the S&P 500 Index. The indexes referenced herein are unmanaged and cannot be directly invested in.
There is no assurance that any investment, plan, or strategy will be successful. Investing involves risk, including the possible loss of principal. Past performance does not guarantee future results, and nothing herein should be interpreted as an indication of future performance. Please consult your financial professional before making any investment or financial decisions.
Mariner is the marketing name for the financial services businesses of Mariner Wealth Advisors, LLC and its subsidiaries. Investment advisory services are provided through the brands Mariner Wealth, Mariner Independent, Mariner Institutional, Mariner Ultra, and Mariner Workplace, each of which is a business name of the registered investment advisory entities of Mariner. For additional information about each of the registered investment advisory entities of Mariner, including fees and services, please contact Mariner or refer to each entity’s Form ADV Part 2A, which is available on the Investment Adviser Public Disclosure website. Registration of an investment adviser does not imply a certain level of skill or training.