Trick or Treats as We Move Into Late Fall? Perhaps a Bit of Both.
“I used to think that if there was reincarnation, I wanted to come back as the president or the pope or a .400 baseball hitter. But now I would like to come back as the bond market. It can intimidate everybody.”
—Well-known political strategist James Carville
In prepping for this month’s commentary, I did a little research on the origins of Halloween since this celebration marks the transition into our holiday season and close-of-year festivities … as well as close-of-year investment results. I was amused by what I learned.
Halloween is not the uniquely American tradition I thought it might be. Its roots go back thousands of years to the Celtic celebration of Samhain in Europe. Samhain (pronounced “sow-win”) entailed various festivities that marked the end of harvest and the beginning of the Celts October “new year.” During Samhain, folks believed they could more easily communicate with the dead. To appease friendly deities, they attended bonfires wearing animal heads and skins to ward off evil spirits. In fact, this is thought to perhaps be the inspiration for us to don costumes today as part of our Halloween celebrations and trick or treating escapades.
The Celts also believed that spiritual communication during Samhain made it easier to predict the future. While it is intriguing to consider the idea that adorning Halloween costumes and attempting to connect with ghosts of the past may make us more accurate in formulating our Crystal Ball calls about the economy and markets, please don’t fret. This is not part of our process. We stick to evaluating the fundamental, valuation and technical metrics (the FVTs) of the financial markets to do this!
Continuing Positive Trends in FVTs
In that vein, the news flow on the FVTs in October and early November contained some treats. The payroll data for September that was released in early October revealed that job growth was robust. In September, 254,000 new jobs were created, and we saw positive revisions for prior months.1 Although the October payroll numbers published in early November showed tepid job growth, the figures were negatively impacted by labor strikes and hurricanes. Adjusting for these temporary influences, the payroll figures send a good message: The labor market is slowing but to still-healthy levels.
This is confirmed by looking at the three-month rolling average in the payroll growth figures and the very low unemployment claims data. Wage growth continues to exceed the inflation rate, and this continued rise in real wage growth is driving sustained growth in personal disposable income and consumer spending. The 4.1% unemployment rate remains at historically low levels.2 The initial read on Q3 real gross domestic product growth of 2.8% was very solid.3 It was balanced with the consumer, business and government sectors all contributing. The inflation data contained in the report confirmed that trends are pacing very close to the Federal Reserve’s inflation target of 2.0%.
Consumer confidence came in far better than expected. Retail sales growth surprised to the upside. The purchasing managers’ data for service sector activity topped forecasts and remains at high levels. Third quarter earnings reports are solid with roughly 75% of companies beating expectations and guidance such that the S&P 500 remains on track to generate 9%+ earnings-per-share growth in 2024.4
This collage of data seemed to represent a bag of pretty good candy to us. It sure doesn’t signal a looming recession that the bear camp seems to incessantly fear. Eventually they will be right, but a broken clock is right twice per day.
Seasonality: An Early Fall Headwind? Not This Year!
Historically, the early fall season often seems to have been filled with tricks rather than treats. So far, we have escaped the common seasonal headwinds in September and October. September is historically the weakest month for stocks with an average monthly return that is negative; October is known for some horrific experiences—crashes of 1929, 1987 (worst single-day loss on record) and 2008 (Lehman Brothers bankruptcy). Not this year as the fundamentals, as outlined above, remain quite constructive.
As a result of these solid fundamental treats delivered by our economy and businesses so far this year, the S&P 500 was up close to 2% in September, and it held up quite well during October when the index was down slightly less than 1% in this periodically ghoulish month after a 1.9% decline on Halloween.5 The S&P 500 has advanced nearly 21% year to date in 2024 on the heels of the 26%+ showing in 2023 when most were extremely bearish.6 Bottom line, the S&P 500 is trading at close to all-time highs as of this writing.
Is a Santa Claus Rally Ahead?
Given this backdrop, I’m sure the question on readers’ minds is whether we think the economy and market have more treats in store for us or if there are some significant tricks in the offing as we move through November and December.
From a seasonal standpoint, November and December typically are stronger months for the S&P and are often punctuated by a nice “Santa Claus rally.” It tends to be a time of cheer on both Main Street and Wall Street as we celebrate the holidays. In 2023, for example, we experienced a Santa Claus rally of historic proportions as the S&P 500 surged 14% in last year’s final two months to make for a stellar calendar year in the market. In addition to this Santa Claus rally phenomenon, the market also generally sees a post-election bounce in presidential election years after election outcome uncertainty disappears, regardless of who wins.
In this environment, one would think that there is a high probability of impressive returns in store for investors as we close out 2024. We aren’t counting on that this year, however, since returns have been so robust already in 2024. The S&P 500 trades at a price level of roughly 5,800 at present, which is above the calendar year-end 2024 price target of 5,400 we established back in January. Earnings are healthy, but price-to-earnings (P/E) multiples are full. We also haven’t seen the usual modest pullback that generally occurs in the couple of months right before the election. Perhaps the Santa Claus rally was pulled forward this year because of investor glee inspired by stronger-than-expected economic and earnings data delivered throughout this year, the progress in taming inflation and accelerating signals from the Fed that they are poised to execute a policy to cut rates for some time.
Time to Take Profits and Pare Your Allocation
Rather than a rally at year-end, perhaps we’ll just mark time for several months and go nowhere, allowing earnings to grow into the higher P/E multiple. Or perhaps we’ll see a slight correction. Up, down or sideways in these months … we really don’t care. We don’t find the short-term path relevant. Regardless, calendar-year returns should rest somewhere in handsomely positive territory in 2024. Should the S&P 500 swoon a bit from here and simply attain our previously established target of 5,400, when all the dust settles at year-end, it will still represent a pleasant 15% gain for the year.
Further, we play the longer game, not the short-term two-month or day-trade game. Based on the solid earnings expectations and reasonable valuation assumptions, we look for the S&P 500 to trade at the 6,000 level by mid-2025 in our base case and at 6,500 by year-end 2025.
If the surge to the 5,800 price level has taken your equity allocation well above your long-term strategic target, now would be a good time to take some profits and pare back to normal. We don’t suggest going below normal, however, due to the solid FVTs and our expectation for the S&P 500 to hit new highs throughout 2025.
Is the Political Venom and Election Outcome the Looming Trick?
We certainly don’t think so. It is far too premature to adjust portfolios based on speculation about election outcomes and potential policy transition. So many strategists are wont to appear smart and prescient by examining policy differences between the political candidates and parties and suggest that one should adjust portfolios now based on speculation about policy impacts. In our view, this is premature, foolish and a money-losing proposition. It is a fool’s errand. Take the time to see how policy unfolds. What one campaigns on is often disconnected from what is proposed post-election and what is eventually approved or passed. Even if one has complete clarity and precision on these two factors, it still is a roll of the dice on how investors will initially react.
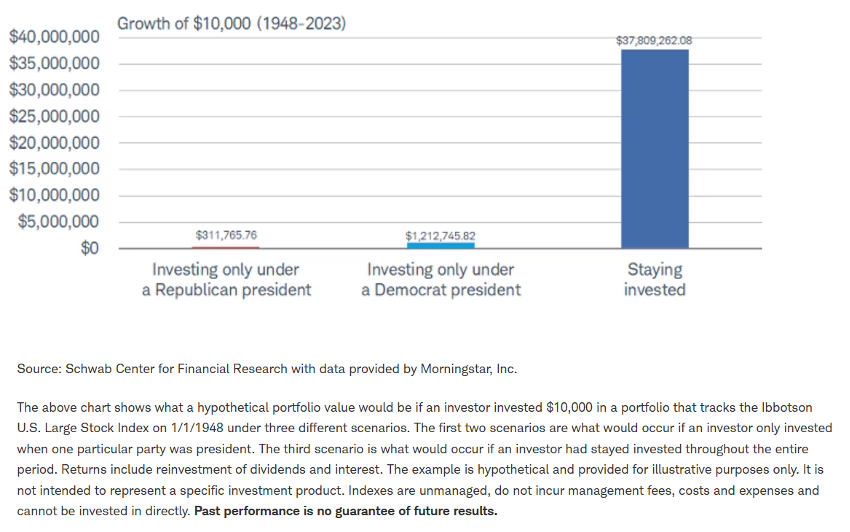
We applaud folks being passionate about supporting their candidates and their policy stances on various issues, but this is a totally separate world from economics and investing. Our suggestion: Stick to the trend in fundamentals to drive investment decisions. Don’t overthink it. Politicians propose but market fundamentals dispose! The chart below illustrates the wealth destruction an investor would have suffered had they been in the market only during the time their party controlled the White House versus staying invested, regardless of who leads. That’s because the FVTs drive the market in the long run—not political leadership.
What Risks Are We Concerned About?
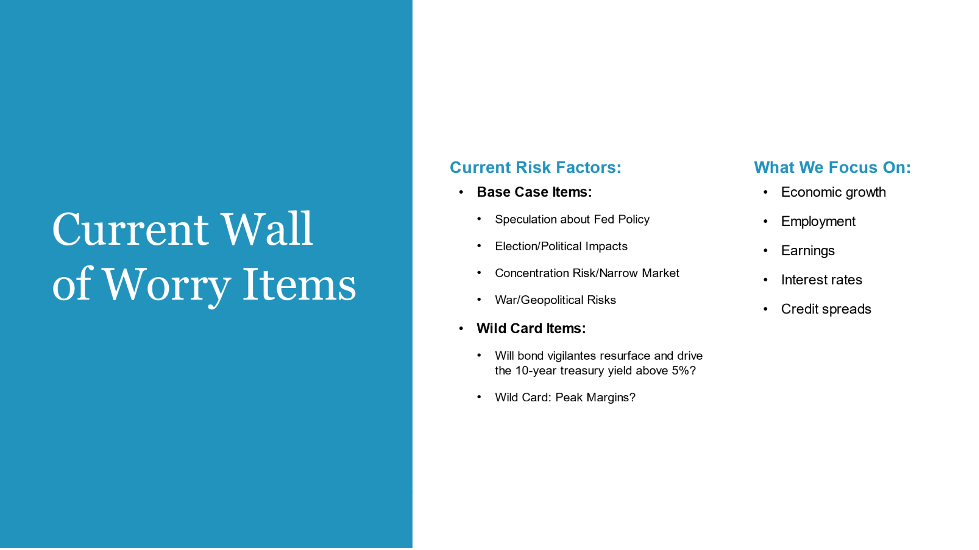
There are legacy concerns that we find to be old and tired—and then there are real issues. We stay focused on the latter. Still at the top of the list of the legacy wall of worry issues are risk items constantly trumpeted in the headlines. These include speculation about Fed policy risk; fears about the presidential election outcome; geopolitical risks; and market concentration risk. Unlike quite a few firms, we feel these are merely drivers of temporary volatility, not of intermediate- and longer-term returns. In examining these issues, we think they will be adequately managed and will not result in worst-case outcomes as the more bearish-prone observers suggest.
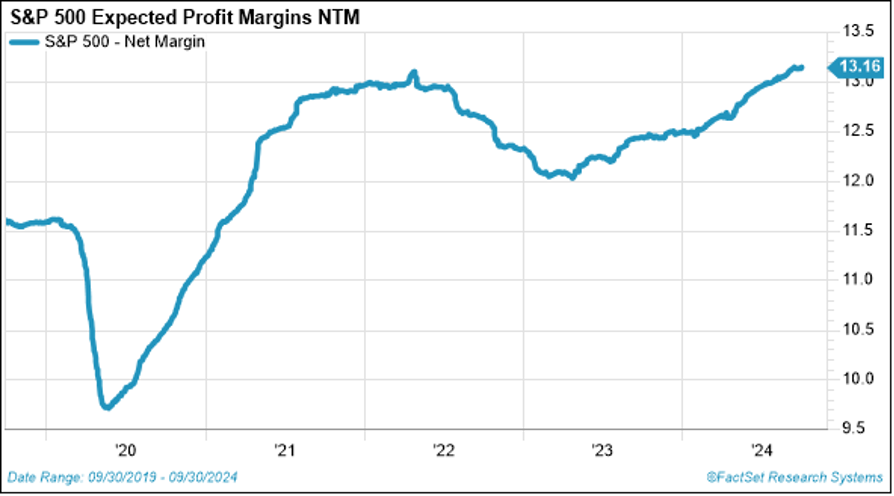
The real concerns we are focused on include: 1) The risk that interest rates rise to uncomfortable levels from here and 2) The risk that the recent renaissance in labor productivity stalls, thus causing profit margins to peak and corporate earnings growth to fall short. These are not base-case risks; rather, they are lower-in-probability events and wildcard in nature. However, they are worth closely monitoring. Barring their shift into higher probability events, we remain positive.
Rising Interest Rates
Regarding the first wildcard risk concern we are watching—rising rates—more than a few strategists have expressed alarm that the 10-year Treasury yield has risen from 3.6% immediately before the September Fed rate cut of 50 basis points up to around 4.25% soon after. They worry that this has been inspired by the so-called bond vigilantes’ potential shift in mood from positivity (generated by the declining trend in inflation this year) to skepticism fostered by reawakened fears that inflation could reaccelerate and that the federal deficit and debt load are just at untenable levels. No doubt we are watching this.
The quote from James Carville at the beginning of this commentary is correct: the bond market can intimidate everybody. A surge in 10-year yields well above the 5% threshold is not something we want to see. The stock market will not like that! That said, we think the bond market was overpriced prior to the Fed rate cut and that yields had fallen to lower-than-sustainable levels at that point. If inflation is running at 2.5%, the long-term real fed funds rate is 1% and the normal 10-year yield premium is 1% above that, the 10-year yield should be roughly 4.5%—just about where it is now. The current level of rates is right in the range of our base-case assumptions.
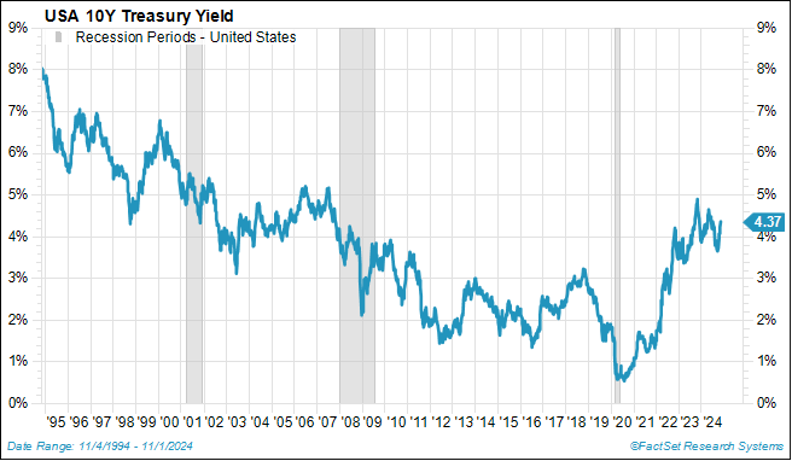
Further, when rates do bounce back a bit as they have, it matters why they are rising. We think it is much more likely that rates have risen to normal levels because economic growth has recently been reported at levels substantially greater than anticipated by the skeptics and investors’ realization that perhaps the Fed won’t need to cut rates as much as forecast to prevent unemployment from rising uncomfortably. We’d much rather see rates rising because growth is solid and better than expected than because inflation is reaccelerating. We will monitor trends in rates and probable cause closely, though. The Treasury auctions have been going well, and the execution and functioning of future auctions will tell us whether the federal deficit is getting out of control. So far, so good.
Labor Productivity and Profit Margins
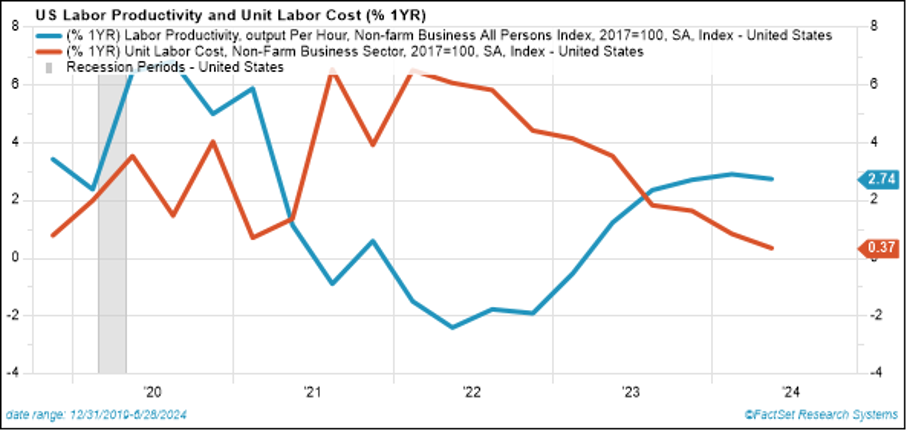
In terms of the second wildcard risk, trends in labor productivity and profit margins, we feel pretty good at present. Productivity in 2024 has doubled versus last year. Greater efficiency is being driven by exciting technological developments such as enhancements in AI solutions as well as by more mundane blocking-and-tackling progress like lower quit rates and workers gaining more experience staying on the job longer. This isn’t discussed much in the press, but it is such an important catalyst. Rising productivity enables companies to continue to increase nominal wages at healthy annual clips of 3% to 4% without feeling pressure to raise prices. Because workers produce more output and services per hour, unit labor costs are rising very slowly and are basically flat versus last year.
The bottom line is that companies can afford to reward staff handsomely while maintaining or even increasing profit margins when productivity is rising. This is key and unappreciated by the media and much of the investment community. The issue here is that current consensus estimates require this renaissance in productivity to continue. Should this trend falter, profit margins in our base case might fall short, and so could earnings. That’s why we monitor this trend closely.
Possible Portfolio Imbalances and Wrap-Up
We’ve had quite a good year in the stock market so far. Whether there’s a bit of a giveback in the final two months or we see a typical Santa Claus rally at year-end, 2024 results should be solid regardless. In either case, we expect 6,000+ levels in the S&P 500 in 2025. Because of the recent shift in Fed policy to accommodation and an expected decline and renormalization in short-term rates going forward, one may want to review their current level of cash balances. In addition, given the strong relative performance of U.S. stocks, and U.S. growth stocks in particular, be on the lookout for other portfolio imbalances that may have developed. Consider the following:
- With the rise in short-term rates during the 2022/2023 Fed rate-hike cycle, investors have flocked into money market funds. With the Fed pausing and now cutting fed fund rates in September 2024, the yield curve is starting to normalize and resteepen. This may be a good time to check in with your wealth advisor to make sure you are not holding excessive cash balances.
- The U.S. economy has indeed been “the envy of the world” these last two years. As a result, U.S. stock market capitalization now represents over 64% of global stock market capitalization, far above the 45% figure of only several years ago. If you have little or no exposure to international stocks, this may be an opportune time to adjust exposure to more normal long-term strategic targets in international.
- Finally, within the U.S. stock market, the mega-cap growth stocks have outperformed by a significant margin such that they have become a large component of stock indices. This gives rise to concentration risk. For example, the Mega 8 now represent more than 50% of the Russell 1000 Growth index.
Don’t misunderstand. We don’t suggest abandoning growth stocks at all—we have solid exposure to them in our active internal equity strategies that we manage on your behalf. However, we under-own these mega-cap growth holdings relative to their large weights in their passive benchmark indices in recognition of building concentration risk. In other words, this is a great time to embrace active management to manage concentration risk, and we appreciate the opportunity to offer active strategies in your portfolios.
Wishing You a Happy Thanksgiving!
Sources:
1,2FactSet, Bureau of Labor Statistics
3U.S. Bureau of Economic Analysis, FactSet
4-6FactSet
This commentary is provided for informational and educational purposes only. As such, the information contained herein is not intended and should not be construed as individualized advice or recommendation of any kind.
The opinions and forward-looking statements expressed herein are not guarantees of any future performance and actual results or developments may differ materially from those projected. The information provided herein is believed to be reliable, but we do not guarantee accuracy, timeliness, or completeness. It is provided “as is” without any express or implied warranties.
The S&P 500 is a capitalization-weighted index designed to measure the performance of the broad domestic economy through changes in the aggregate market value of 500 stocks representing all major industries. The Russell 1000® Growth Index measures the performance of the large cap growth segment of the US equity universe. The indexes referenced herein are unmanaged and cannot be directly invested in.
Mega 8 stocks include Alphabet, Amazon, Apple, Meta, Microsoft, Netflix, NVIDIA and Tesla.
Equity securities are subject to price fluctuation and investments made in small and mid-cap companies generally involve a higher degree of risk and volatility than investments in large-cap companies. International securities are generally subject to increased risks, including currency fluctuations and social, economic, and political uncertainties, which could increase volatility. These risks are magnified in emerging markets.
Fixed-income securities are subject to loss of principal during periods of rising interest rates and are subject to various other risks including changes in credit quality, market valuations, liquidity, prepayments, early redemption, corporate events, tax ramifications, and other factors before investing. Interest rates and bond prices tend to move in opposite directions. When interest rates fall, bond prices typically rise, and conversely, when interest rates rise, bond prices typically fall.
There is no assurance that any investment, plan, or strategy will be successful. Investing involves risk, including the possible loss of principal. Past performance does not guarantee future results, and nothing herein should be interpreted as an indication of future performance. Please consult your financial professional before making any investment or financial decisions.
Mariner is the marketing name for the financial services businesses of Mariner Wealth Advisors, LLC and its subsidiaries. Investment advisory services are provided through the brands Mariner Wealth, Mariner Independent, Mariner Institutional, Mariner Ultra, and Mariner Workplace, each of which is a business name of the registered investment advisory entities of Mariner. For additional information about each of the registered investment advisory entities of Mariner, including fees and services, please contact Mariner or refer to each entity’s Form ADV Part 2A, which is available on the Investment Adviser Public Disclosure website. Registration of an investment adviser does not imply a certain level of skill or training.

